PROJECT PART 2: DATA AND DESCRIPTIVE STATISTICS
Part 2: Data and Descriptive Statistics (45 points total)
In this section you will expand your project to include your actual data set, descriptive statistics for your quantitative variables, and a discussion of your results so far.
Your project should be submitted as a professional report including everything from Part 1 and 2 using the following template. If you did not do Part 1: you must obtain approval from your instructor on your variables before collecting data. If Part 1 is missing, you will still lose completeness points.
The description in italics indicates the information required in each section.
(Part 1 of your project here)
Sampling Method
Based on the population identified in Part 1, describe an appropriate sampling technique to use for collecting data. Discuss how your participants will be identified/contacted; when and where will your study take place? For example, I might want to use a sample stratified by gender when looking at the relationship between study hours and GPA. To acquire my random sample within each strata, I might use a systematic sampling technique where I ask every 10th female or male entering RCF to participate.
NOTE: Ideally every study would have a very carefully designed sampling method where every person in the population is equally likely to be in the sample. Unfortunately, we have a limited budget and timeline for our classroom projects. There are still weaknesses in my example above that would needed to be raised in the discussion of my results (see below).
Data
Collect your own data set using your survey and following the plan you set out in part 1. You should have at least 20 cases (subjects).
In order to satisfy good ethical practices, if you plan to survey human subjects, it is essential that they consent to being surveyed and that their information is protected. Please do not pressure anyone to participate and please keep identities confidential.
Participant
Variable 1:(insert var name here)
Variable 2:(insert var name here)
1
enter data …
2
… …
…
…
…
Descriptive Statistics for <Variable 1 name>
Briefly introduce your variable and report the summary statistics (mean, standard deviation, 5-number summary and IQR).
Create both a histogram and modified boxplot for variable 1. You can choose what technology to use, but it must look professional (hand drawn histograms or boxplots will receive no credit). Indicate what technology was used and a brief description of the process.
Use the histograms and boxplots to describe the distribution. Discuss the shape (modality, symmetry/skew) and unusual features of your data. For the boxplot report the fences and any outliers, sharing the formula/calculations used.
Compare the mean and median, discussing whether the mean or median is a better measure of center and explain why. Compare the standard deviation and IQR, discussing which is the better measure of spread. Explain why.
Descriptive Statistics for <Variable 2 name>
Briefly introduce your variable and report the summary statistics (mean, standard deviation, 5-number summary and IQR).
Create both a histogram and modified boxplot for variable 2. You can choose what technology to use, but it must look professional (hand drawn histograms or boxplots will receive no credit). Indicate what technology was used and a brief description of the process.
Use the histograms and boxplots to describe the distribution. Discuss the shape (modality, symmetry/skew) and unusual features of your data. For the boxplot report the fences and any outliers, sharing the formula/calculations used.
Compare the mean and median, discussing whether the mean or median is a better measure of center and explain why. Compare the standard deviation and IQR, discussing which is the better measure of spread. Explain why.
Discussion
Based on the analysis above, discuss at least 2 interesting results from your analysis. For example, when looking at data about the hours students study, I might be surprised at the variation among students and discuss how this is demonstrated by the measures of spread found.
Ideally every study would have a very carefully designed sampling method where every person in the population is equally likely to be in the sample. Unfortunately, we have a limited budget and timeline for our classroom projects . Review the sampling method you used and discuss what limitations you see with your research, including sources of bias or other problems that might limit how well your research generalizes to the greater population (for example, if my survey on study hours and GPA was taken on campus between 2pm and 3pm, few night students are likely to be included).
Upon completion of the template, submit your project via the Canvas link as a PDF or Word file.
GENERAL INSTRUCTION REMINDER
General Instruction Reminder: In this project you are asked to conduct your own research into two variables that interest you. This project will give you an opportunity to apply the skills and techniques you learn in this class and to produce a professional report using appropriate technology. This is a MAJOR, on-going assignment and is worth 15% of your grade; the equivalent of one unit exam grade.
Your projects will be graded in stages (Part 1, Part 2, Part 3) according to the attached rubrics.
To be successful on your project you must:
Read and follow instructions carefully.
Work according to the timeline provided and submit work on time.
10% will be deducted for each calendar day the project is submitted after the due date. A project is considered “submitted” when it is available for the professor to view on Canvas. No credit is given after 5 days late.
Students who fail to submit earlier parts of the project may still submit later parts of the project as long as their topic has been approved by their instructor and as long as they collect their own data. Points will still be taken away for lack of completeness unless those prior sections are completed and included.
Write clearly, using appropriate terminology and accurate mathematical notation. College-level writing is expected, as is the use of correct grammar.
If you need help with writing, feel free to use the HCC Writing Center: For further information, see the HCC Web page under the heading “Writing Center” or call the Writing Center at (443) 518-4101. PGCC students at the Laurel College Center should see the PGCC Writing Center for assistance.
Submit a neat, professional report typed using your choice of word processing software (including a mathematical notation package) and including printouts and diagrams from your choice of statistical software/technology.
In particular, embedded graphs or charts and/or computer printouts will be expected as part of the report. Hand-drawn graphs are not acceptable.
Professional homework help features
Our Experience
However the complexity of your assignment, we have the right professionals to carry out your specific task. ACME homework is a company that does homework help writing services for students who need homework help. We only hire super-skilled academic experts to write your projects. Our years of experience allows us to provide students with homework writing, editing & proofreading services.
Free Features
Free revision policy
$10Free bibliography & reference
$8Free title page
$8Free formatting
$8How our professional homework help writing services work
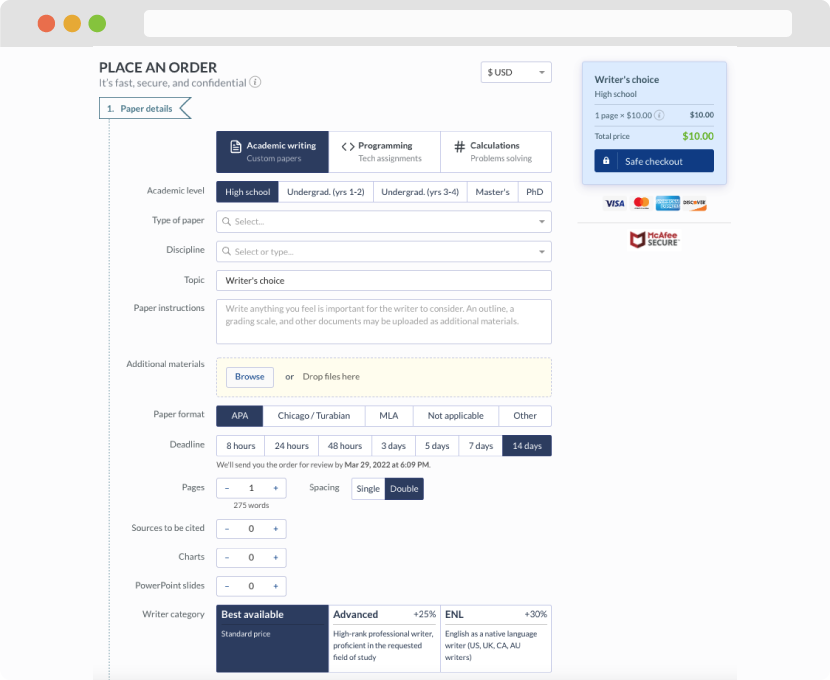
You first have to fill in an order form. In case you need any clarifications regarding the form, feel free to reach out for further guidance. To fill in the form, include basic informaion regarding your order that is topic, subject, number of pages required as well as any other relevant information that will be of help.
Complete the order form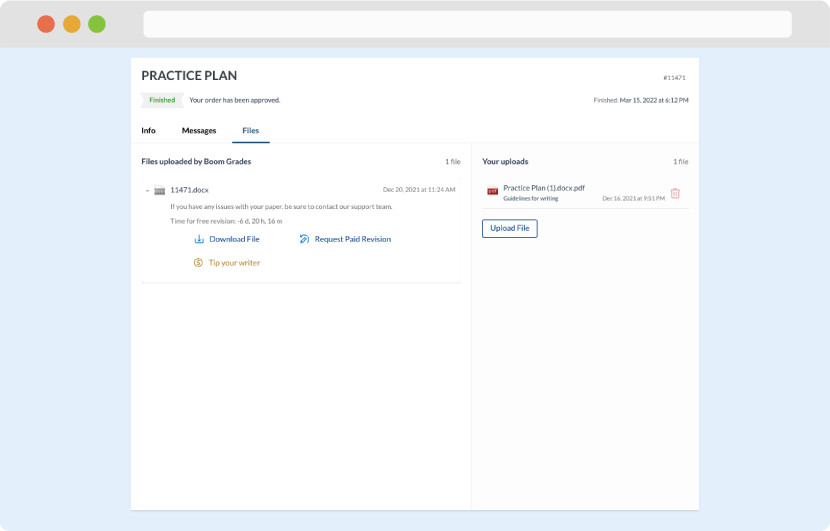
Once we have all the information and instructions that we need, we select the most suitable writer for your assignment. While everything seems to be clear, the writer, who has complete knowledge of the subject, may need clarification from you. It is at that point that you would receive a call or email from us.
Writer’s assignment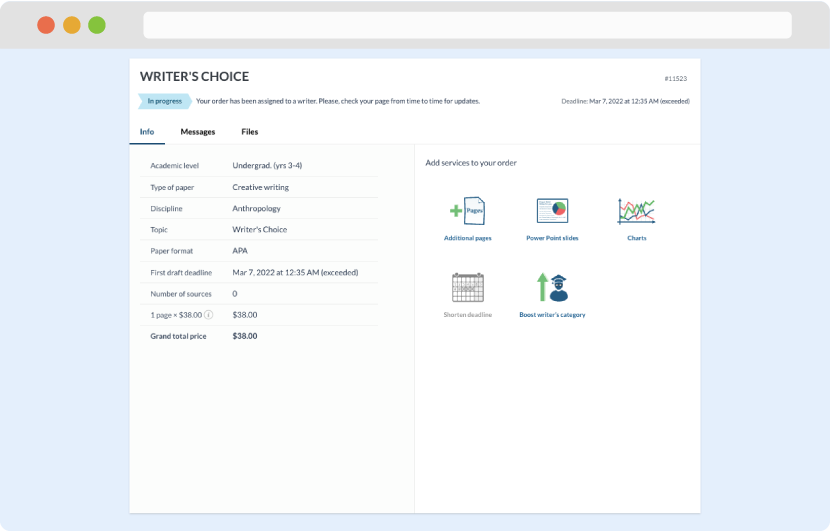
As soon as the writer has finished, it will be delivered both to the website and to your email address so that you will not miss it. If your deadline is close at hand, we will place a call to you to make sure that you receive the paper on time.
Completing the order and download